Online Teaching Tool
Table of contents
A) Background and Aims
Statistics and figures become more understandable if they are experienced in a participatory way (concept of "living statistics", see box on the right side).
The Height Tool enables university teachers to conduct a live study with students in their classrooms on human body height and to discuss aspects of quantitative methods (see grey box on the right) exemplified in the collected data. The target group is beginner courses in quantitative methods.
Body height is particularly suitable thematic hanger because every person has a height, can imagine something about it, and yet cannot influence how large/small s/he is due to the strong genetic component of this body feature.
In the course of the practical teaching unit (a small live study) the students (min. 5 and ideally 10 or more) collect data (body height and some co-variables) about themselves on a voluntary basis and enter these anonymously into the online tool.
Depending on the time available, a teacher can use the online tool for a shorter (superficial) or longer (deeper) course. The strong multidimensional involvement of individual students is intended to promote basic skills in dealing with statistics.
B) The two steps to conduct a live-study in the classroom
1. Students enter their anonymised data into the data entry tool (takes max. 5 min)
Enter your data
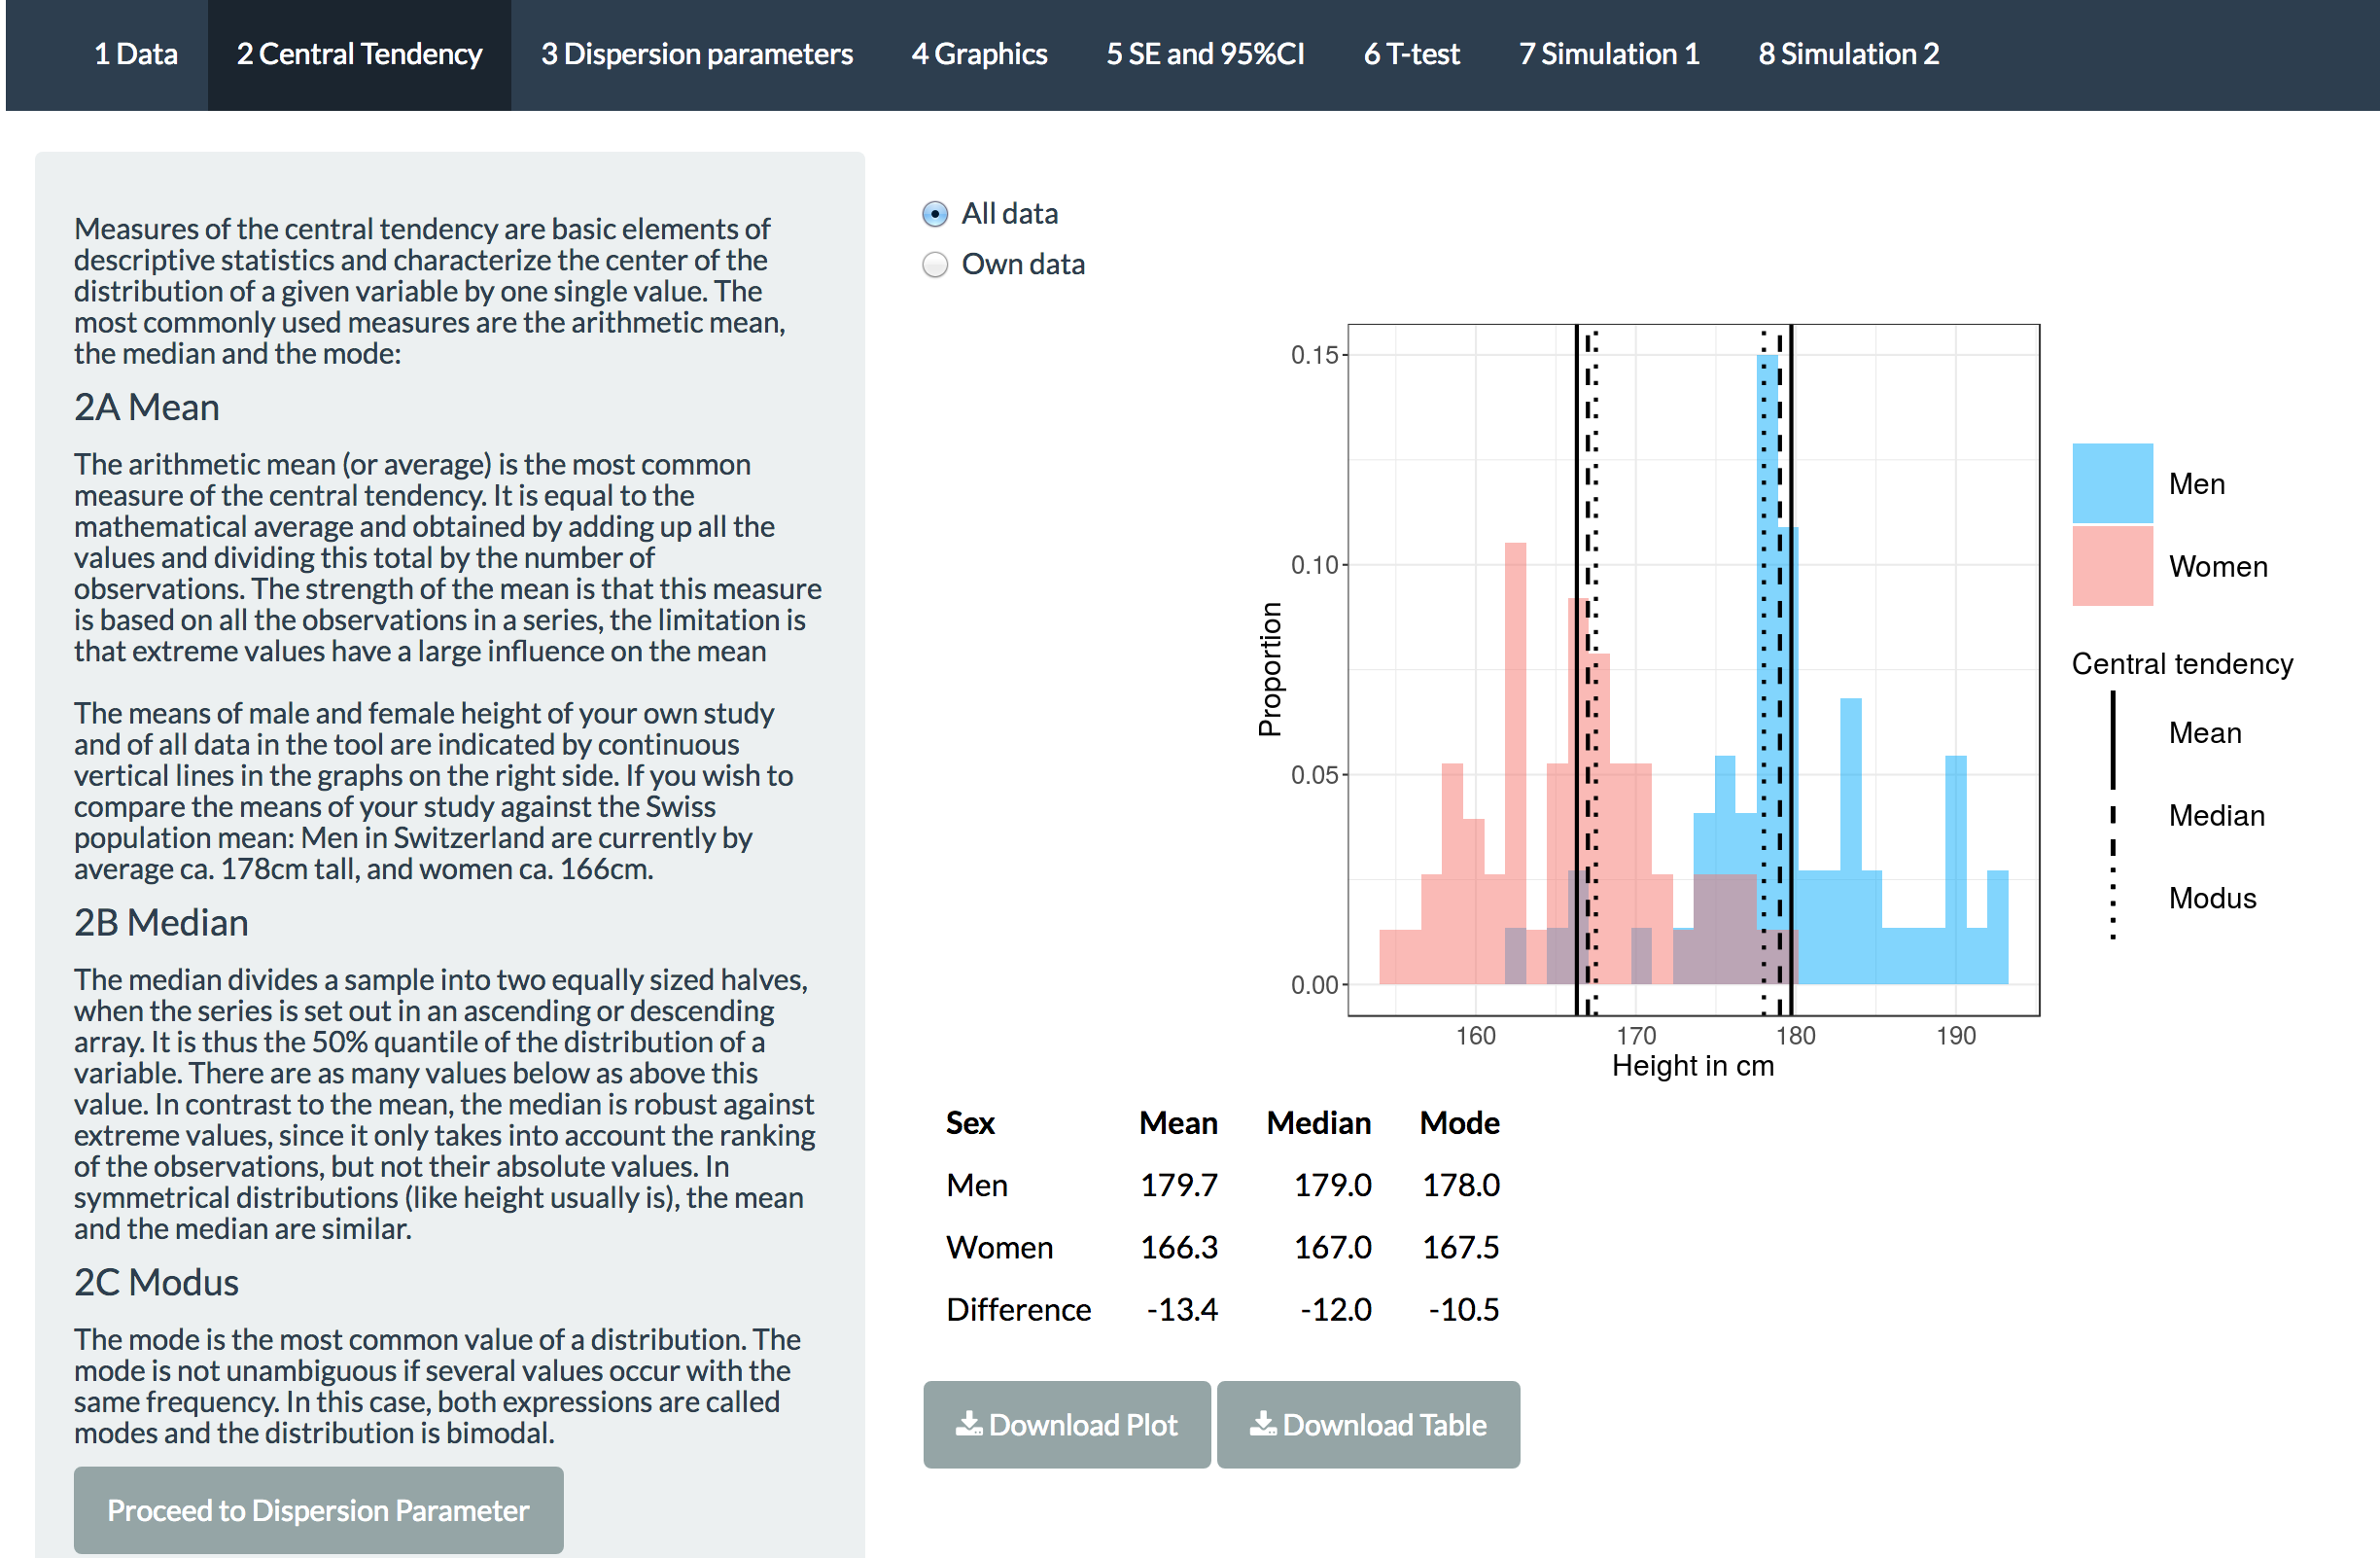
2. See the live-results of your study in the tool and discuss selected basic aspects of quantitative methods (see grey box on the right) using the data:
Visit the tool (you can visit the tool without entering new data)
C) Preview
The Height Tool has been programmed in R Shiny (please get in contact with the Project Team if you are interested in the code).
The sequential menu is horizontally displayed on the top of the page. In the main area in the center you will find results and your data. In the grey box on the left side you will find information on the statistical topic on display and instructions on how to interpret the results.